Everyone is familiar with AI (acronym for Artificial Intelligence), at least the term. It’s a field that has been around for decades and it’s still growing. One of the most exciting things about AI is how it can be used to unlock the Developer Productivity with the invention of coding assistants and AI-powered tools.
The first coding assistant came out of nowhere from GitHub named Copilot, though in the beginning it generated a lot of controversy about how it utilizes the open source repositories to train itself. And the second one is called ChatGPT which has been around since 2018 and it’s still growing. It can answer questions, write and debug code, summarize text, translate languages, play games, etc. This list of AI engines continues to grow and evolve.
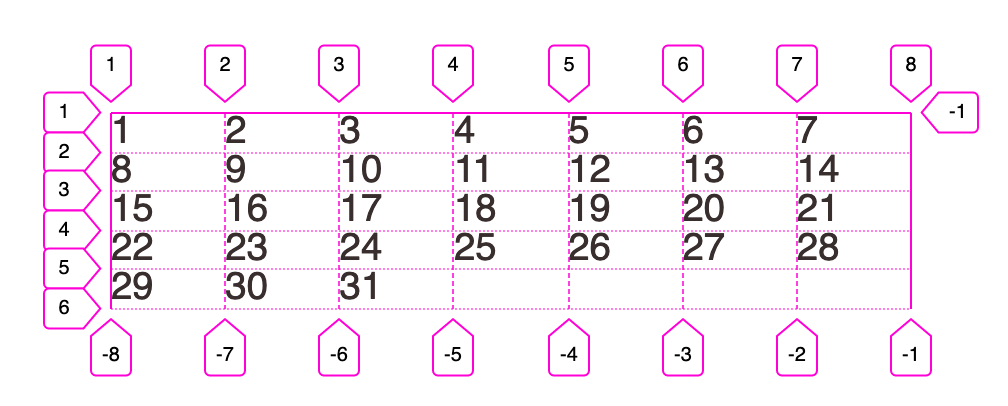
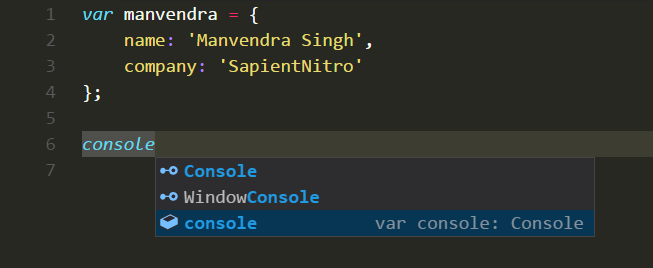
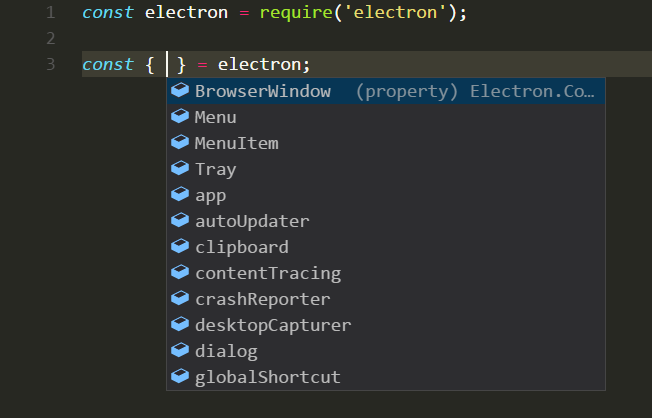
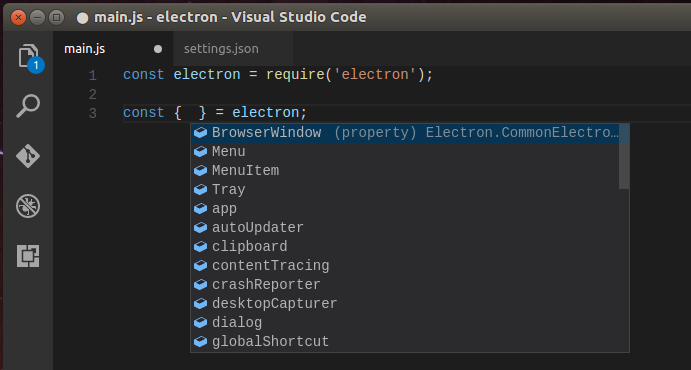
But the true power of coding assistants comes from the power of their inline completions ability as you are typing the code. For instance, let’s say we have some Rust code that creates a variable finland of type Country that in turns holds a vector of City, the Code assistant can give you the following suggestion:

As you can witness, the AI automatically figured out that you most likely are creating Finland country, and as the AI has the code context, it automatically suggested a vector of City for you.
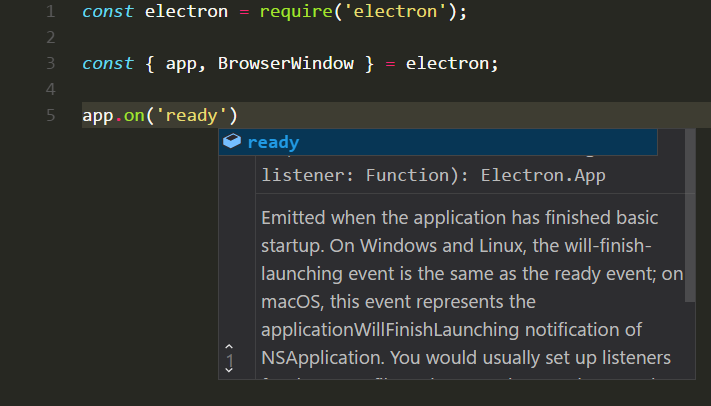
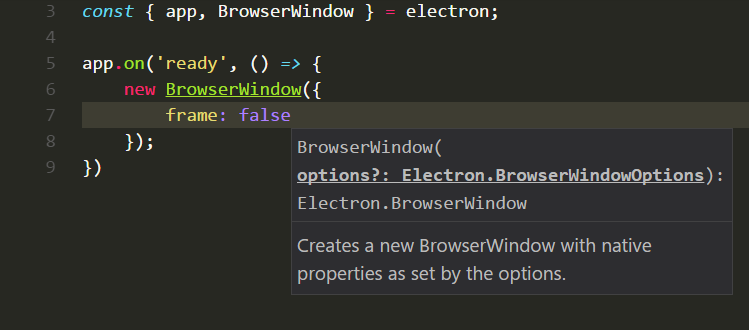
Here are two more examples where AI helped to complete the code you most likely want to write:
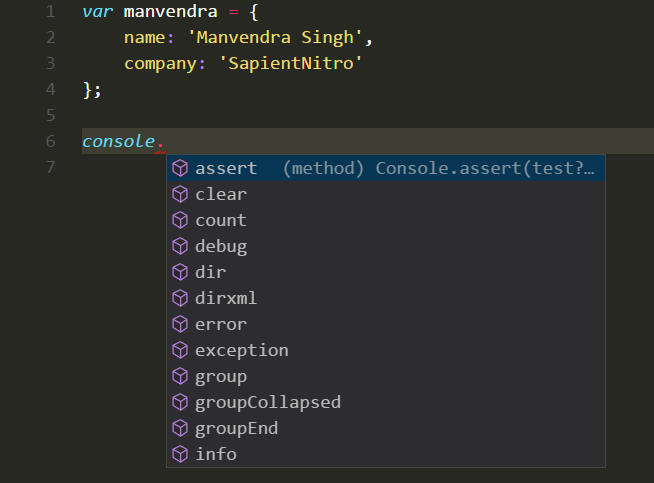
- Assistant automatically suggesting that you might like to create a
newfunction to instantiate a new instance ofCity.
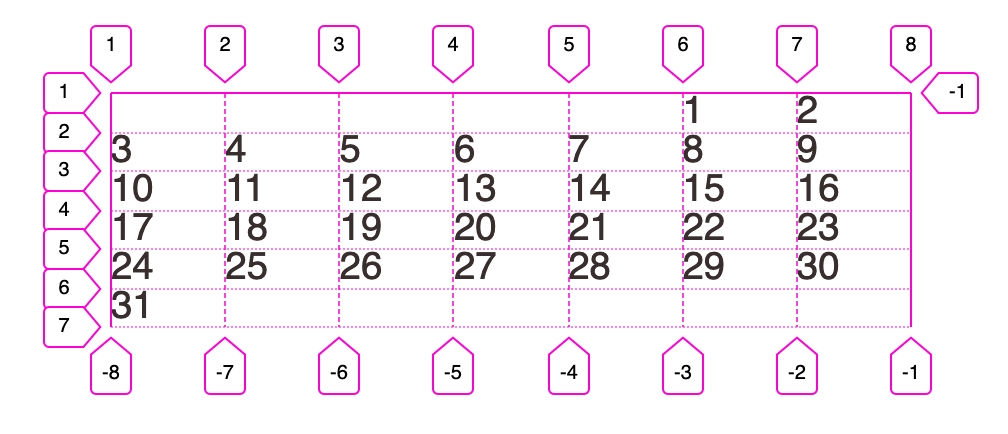
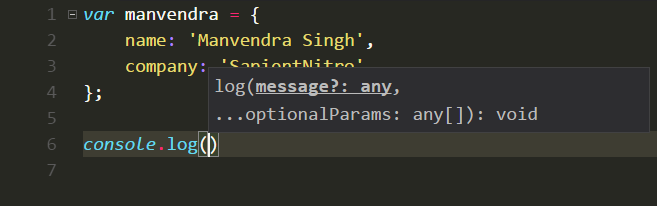
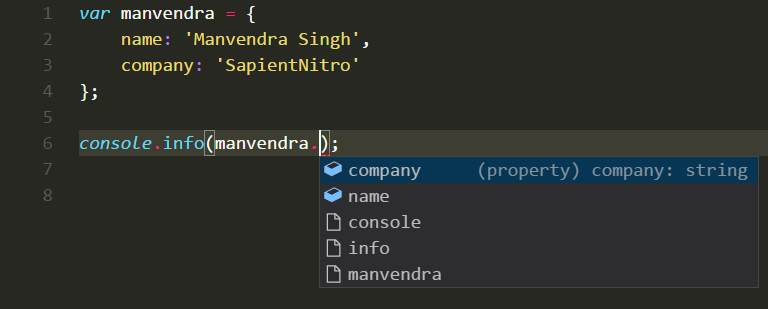
- As in the first screenshot we can see that AI is suggesting to use
fromfunction to create aCountryout of a vector ofCity. That is happening because I implementedFromtrait for theCountrystruct, again with the help of Code Assistant. Here is a step by step Assistant suggestions which I accepted just by pressingTabkey.
a.
b.
c.

What to choose? Local or Remote?
We saw how much helpful a code assistant can be; however, the real question is should you use service like Supermaven, Codium, Copilot or Cursor and others ? Or just run the open source LLMs on your local computer?
💡 BTW LLM stands for Large Language Model while LLaMA stands for Large Language Model Meta AI.
Running a local LLM can help if you are super conscious that you don’t want to share your information in real time to a third party company, though some claim that they delete it after few days. But, it incurs resources usage cost as LLMs are RAM and GPU/CPU incentive and can quickly dwindle down your computer’s performance in milliseconds if you are running a potato 🥔 computer.
On the other hand, using a Remote service frees you from such restrictions but may drill a hole in your wallet/credit card.
💡 In my opinion, paying for a service of ₹8500 ($100) per year makes more sense as compared to buying an expensive Desktop Performance GPU (NVIDIA RTX 4090) which usually costs around ₹2,50,000 ($3,000) upfront.
Here I’ll show you how to use Open Source LLMs running on your own computer.
Ollama and Continue.dev
-
Ollama is an open source LLM initiative that allows users to run LLMss locally, without relying on cloud providers or third-party services. It’s a great tool if you want to use powerful AI capabilities but don’t want to share your data with any third party.
a. Let’s install it on a MacBook Pro using Homebrew:
brew install ollamab. Now run it using the following command. It’ll spin up a GO web server, that would pass the response to a running LLM and will give the response back to you.
ollama servec. Install an LLM. But wait, which LLM to choose? There are various LLMs available for various tasks. We would focus on two LLMs, one is Meta’s llama3.1:8b and the other one is codeqwen:7b. These are reasonably sized and performant models. Moreover, these will not consume much of your computer’s resources.
There is a reason I chose two models as both are specialized in different tasks.
llama3.1is good for general use butcodeqwenis good as a coding assistant. Think of them as ChatGPT and Copilot respectively. You can easily switch between them while chatting insideContinueextension/plugin.Run LLMs using the following commands. Of course, these commands will download the models first if not available locally.
ollama run llama3.1:8bollama run codeqwen:7bd. Assuming your
codeqwenmodel is installed and running we can interact with it in the terminal just like you do with a normal ChatGPT client.
Or, you can even choose to use a GUI application in a browser with a ChatGPT like interface.

I’ll tell you later how to run this GUI application below. For now, let’s talk about
Continue.dev. -
Running an LLM is different than to interact with it in an IDE or TextEditor. Even if you have a running LLM which may respond to your queries just like ChatGPT does, it is not necessary that these will provide editor integrations, this is where Continue.dev comes into picture.
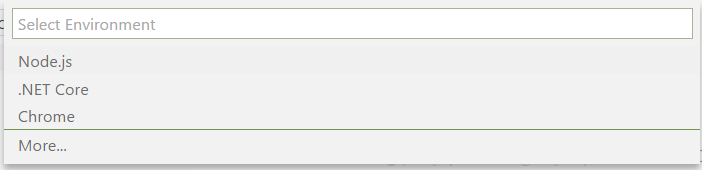
Continueprovides VSCode extension and JetBrains plugin to interact with your local LLM. All we need to do is install and configure it.a. From the Extension’s dropdown select the
Add Chat Modeloption and select the values shown in the screenshot:

b. If required you can even change the settings manually by editing the
Continue’s~/.continue/config.jsonfile. Here is an important excerpt of the configuration. Notice that thetabAutocompleteModelconfiguration selects the LLM that will be used for autocompletion in the editor.{ "models": [ { "title": "Llama 3.1", "provider": "ollama", "model": "llama3.1-70b" }, { "title": "Codeqwen", "provider": "ollama", "model": "codeqwen:latest" }, ], "tabAutocompleteModel": { "title": "Codeqwen", "provider": "ollama", "model": "codeqwen:latest" }, "tabAutocompleteOptions": { "maxPromptTokens": 700, "prefixPercentage": 0.5, "multilineCompletions": "always", "debounceDelay": 100 }, }
You may have noticed that I have used maxPromptTokens: 700 as I find it the sweet spot for my MacBook Pro with M1 Pro Chip and 16GB RAM and anything above it will considerably slow down the completions and not to mention your computer as well (crawling as an earthworm 🤭).
This concludes the Ollama and Continue setup. Now let’s look at how you can get the ChatGPT like browser application running on your computer so that you don’t need to deal with the command line.
Open WebUI
Open WebUI provides the ChatGPT like interface and can be easily installed. It’s recommended that you use Docker to run this web app in a container.
- Install Docker from the official website or Using Homebrew.
- Use following command to pull and run the Open WebUI image. Notice that we are passing
WEBUI_AUTH=falseenvironment variable which will disable the authentication. If you need the authentication then just remove this environment variable from the command.docker run -e WEBUI_AUTH=false -d -p 5000:8080 --add-host=host.docker.internal:host-gateway -v open-webui:/app/backend/data --name open-webui --restart always ghcr.io/open-webui/open-webui:main - The application will now readily be available to chat on
http://localhost:5000as we are mapping the internal8080port to host’s5000port.
Ollama CLI
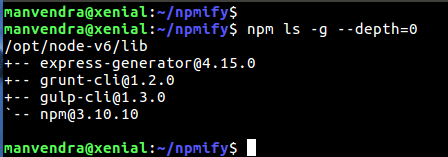
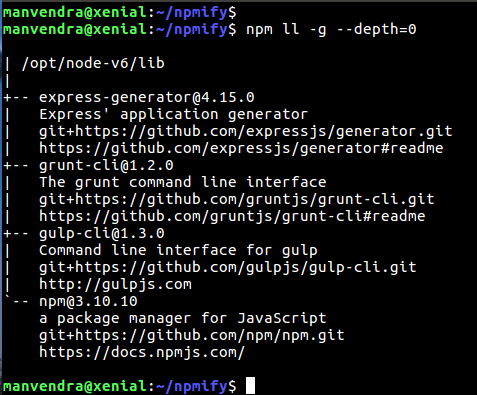
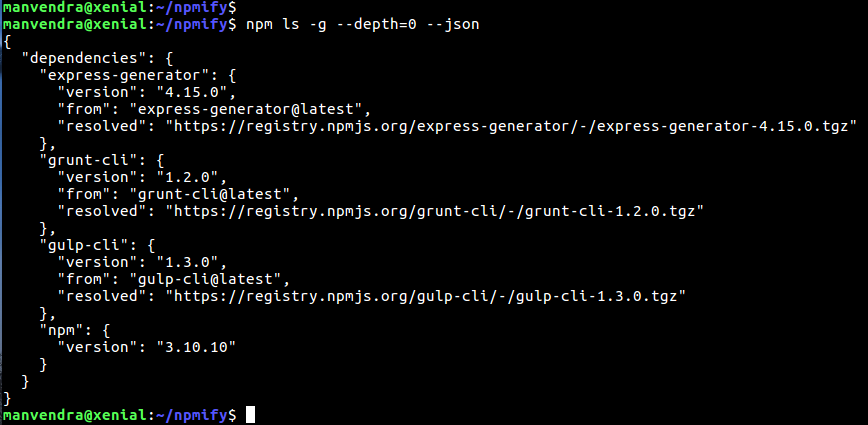
Ollama CLI has some helpful commands that can be accessed by running ollama --help command. Here are two of the most used ones:
Ollama lswill list all the installed models.
ollama pswill list all the explicitly running models.
This concludes the Coding Assistants and Artificial Intelligence for the Rest of Us.
]]>Thanks for stopping by. See you next time.