Node.js Debugging Enhancements
, on JavaScript, Node.js, Editor
DEBUGGING has always been a needed part of the Node.js and its support was first made mainstream by the VisualStudio Code (More on this later in the post). Starting with the v6.x.x LTS release of Node.js we can also use familiar Chrome DevTools.
In essence, Node.js debugging has come a long way since its inception, console.log statements to command line client to VS Code to Chrome DevTools integration.
Let’s get started with each of these in the reverse order when they appeared.
1. Chrome DevTools
Let’s say you have some script in file index.js
const os = require('os');

const cpus = os.cpus();

console.log(`${cpus.length} cpus found. Details follows.`);

cpus.forEach((cpu, i) => {
    console.log(`Model: ${cpu.model}`);
});
This simple script just finds out how many CPUs are on the host machine and prints their model. To debug this script in DevTools you can execute the command node --inspect --debug-brk index.js. This command would spin up a V8 inspector on default port 9229 (can be changed by the option --inspect=8888) and attaches the Chrome DevTools to Node.js instance, allowing us debugging and profiling. This command would result in something like as shown in the figure below:
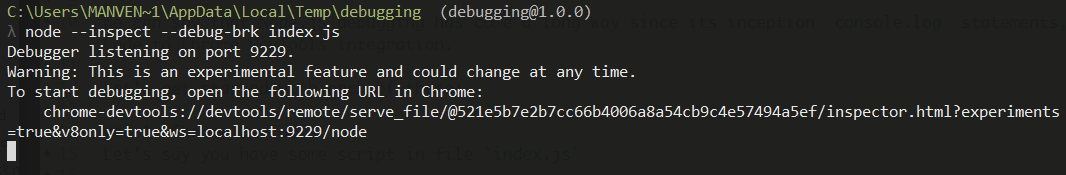
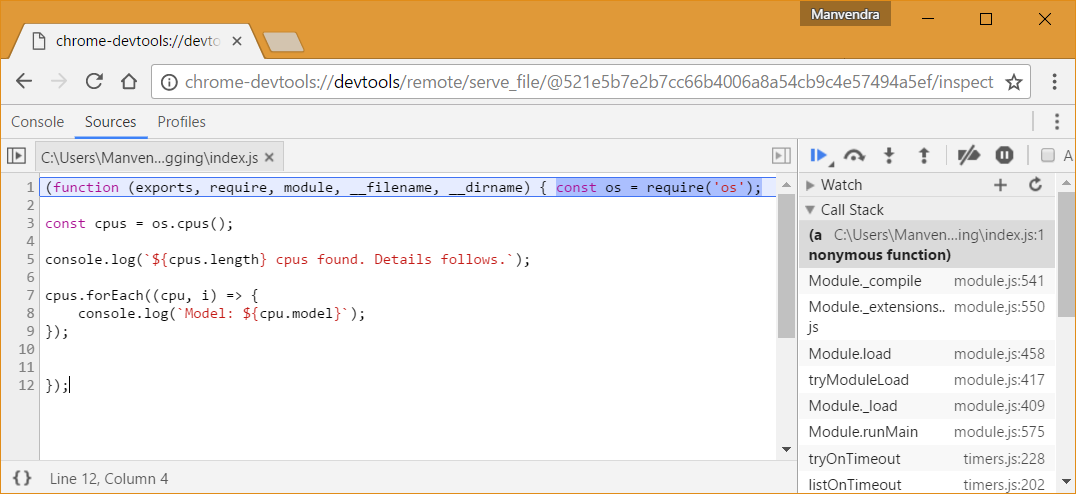
Copy the URL starting with chrome-devtools:// and paste inside Chrome’s new tab. You’ll be welcome by the DevTools with your script loaded in the Sources tab, breaking on the first line. The script has a default breakpoint on the first line due to the presence of the --debug-brk switch in the previous command. If you forget to specify this switch then nothing will get load in the inspector and the script execution would come to an end instantly (which you can verify in the previous image that we didn’t get our prompt back). Here is how it looks like:
Now you can just add few breakpoint by clicking on the gutter in the left and then step into and step over in the code using the toolbar on the right pane. You can add watch statements in the right pane, as can be seen in the image below:
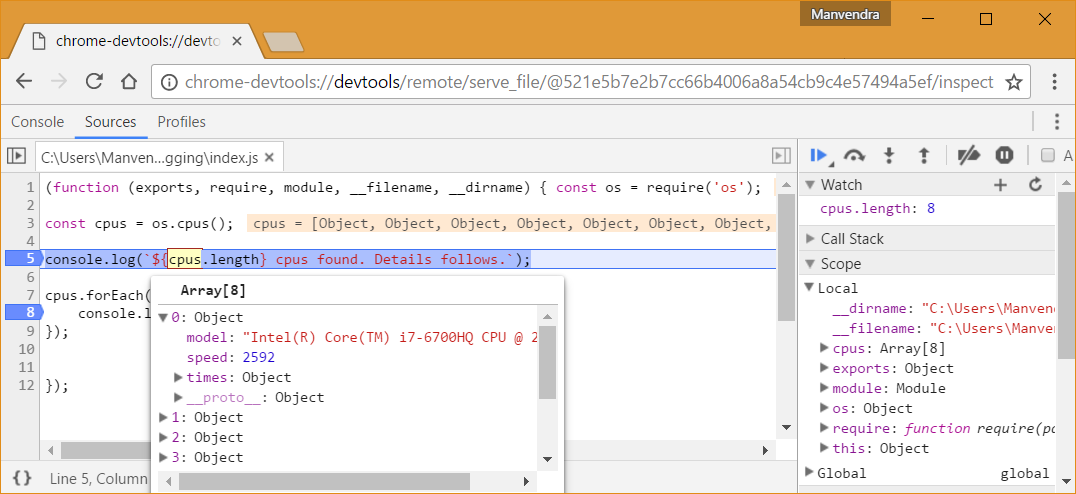
Verify that watch pane is showing the value of cpu.length. We are inspecting cpus constant by hovering our mouse over it.
2. VisualStudio Code
To debug the scripts in VisualStudio Code we again need to do some homework. Let’s see what’s that.
The first step is to open your code folder in the VS Code. Manvendra, that’s obvious, please don’t tell us.
From the left side panel select the 4th icon, that has Bug on it. You’ll see in the following screen.
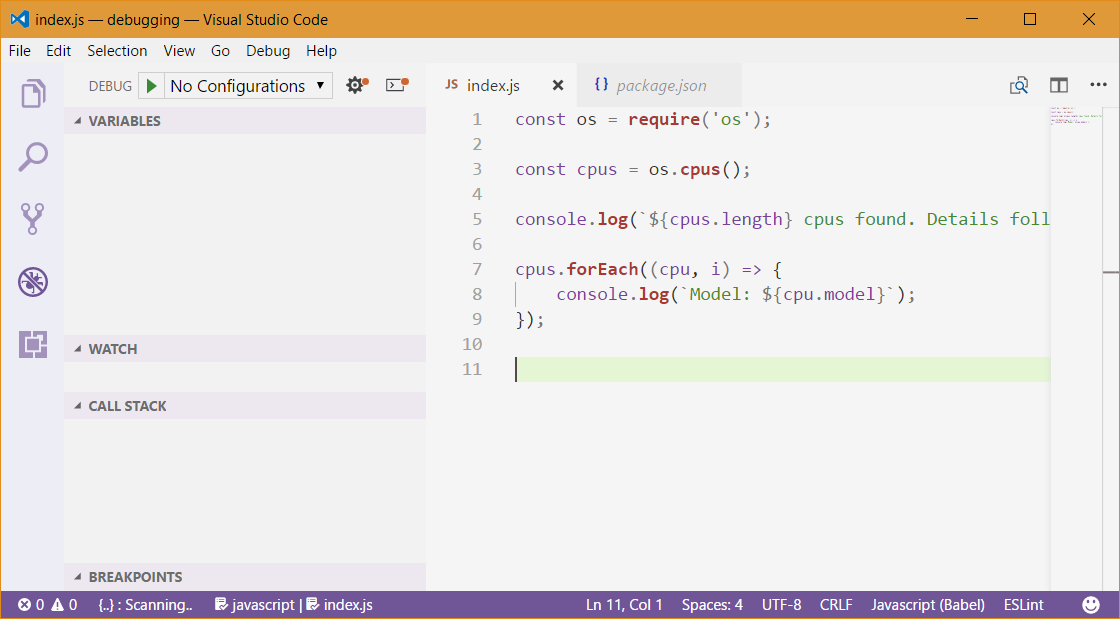
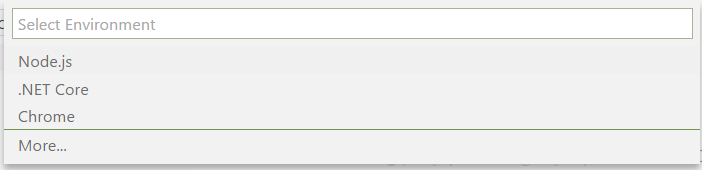
On the top part of the Debug panel, we can see some icons and drop-down menu. The drop-down menu says No configuration. Select the Gear icon next to it and a pop-up will open. Select the Node.js menu item in it.
VS Code will create a new file at .vscode/launch.json. This file contains various settings, but the minimal settings is shown in the image below:
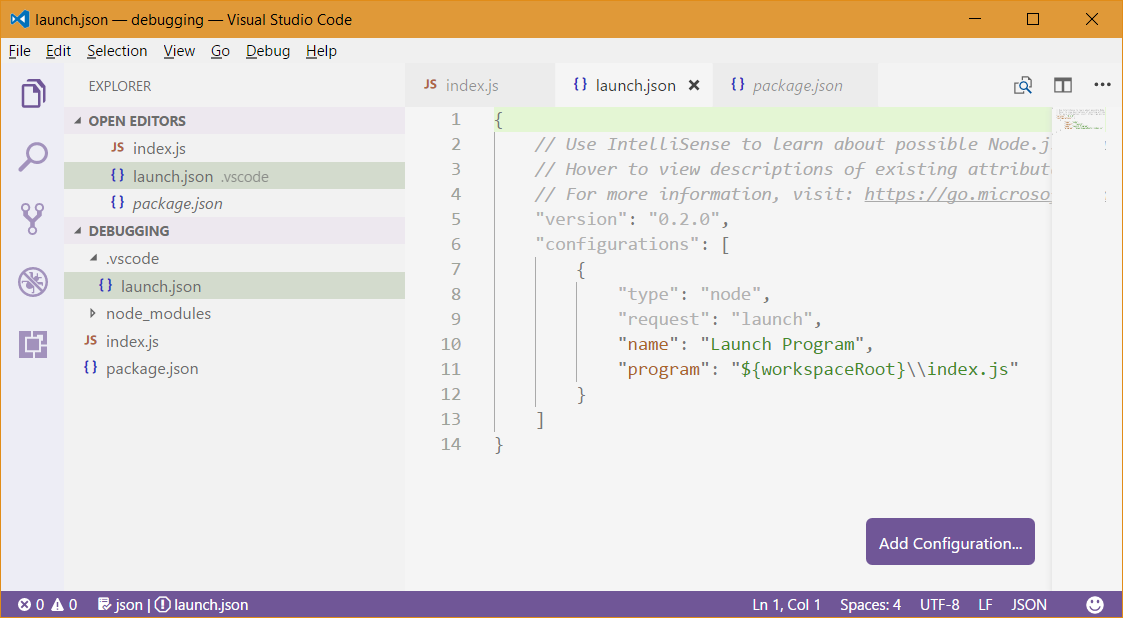
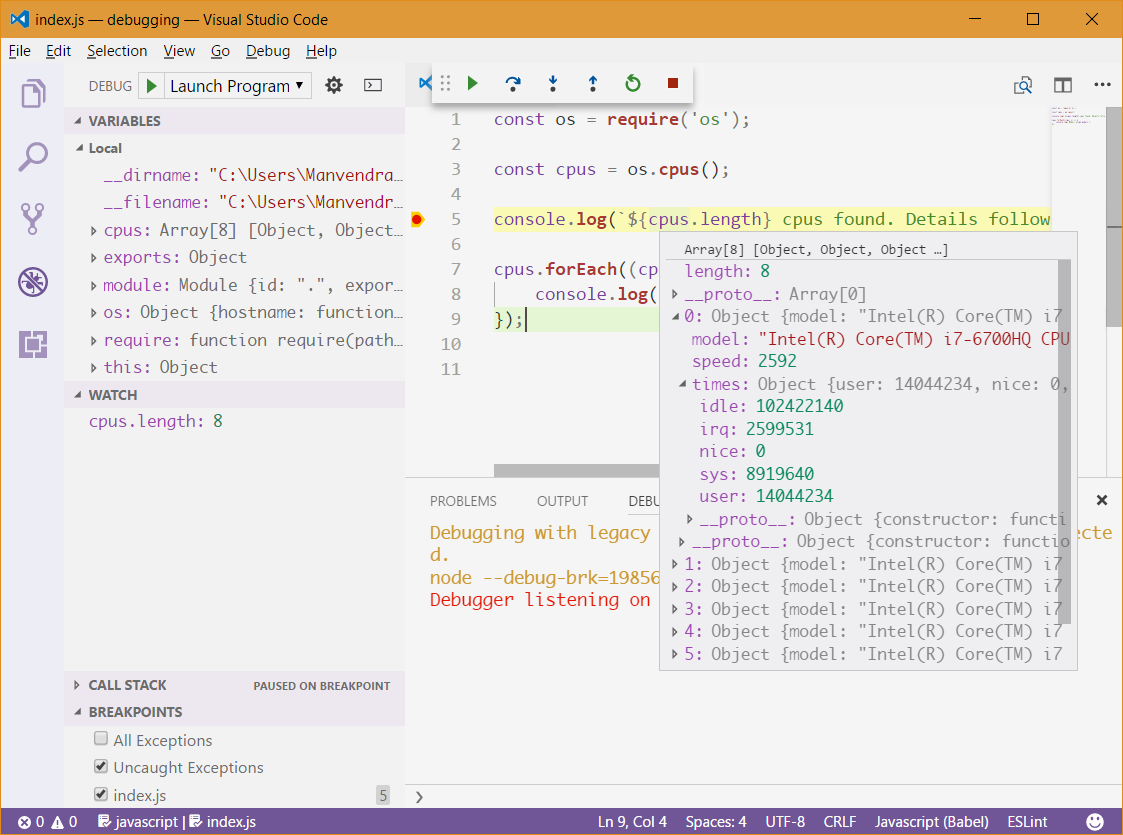
The most important one is program key. It points to your main file. In our case, we have the index.js filename entry. workspaceRoot is a special variable that VS Code uses internally to point to the currently loaded project directory. Now all we need to do is add some breakpoints in the editor gutter and hit the play button in the debug panel. A new toolbar would then visible on top which contains all the usual debugging buttons. See in the image below, we have our watch setup and mouse hovering in action.
More information on this configuration file is available at https://code.visualstudio.com/docs/nodejs/nodejs-debugging.
3. Node.js Debug Client
For those who love command prompt or terminal, there is a separate workflow for the debugging. It’s similar to the GNU C Debugger popularly know as GDB. To start the script execution in debug mode you would need to execute the command node debug index.js. The debugger would by default listen on the port 5858. You can type help for the available commands.

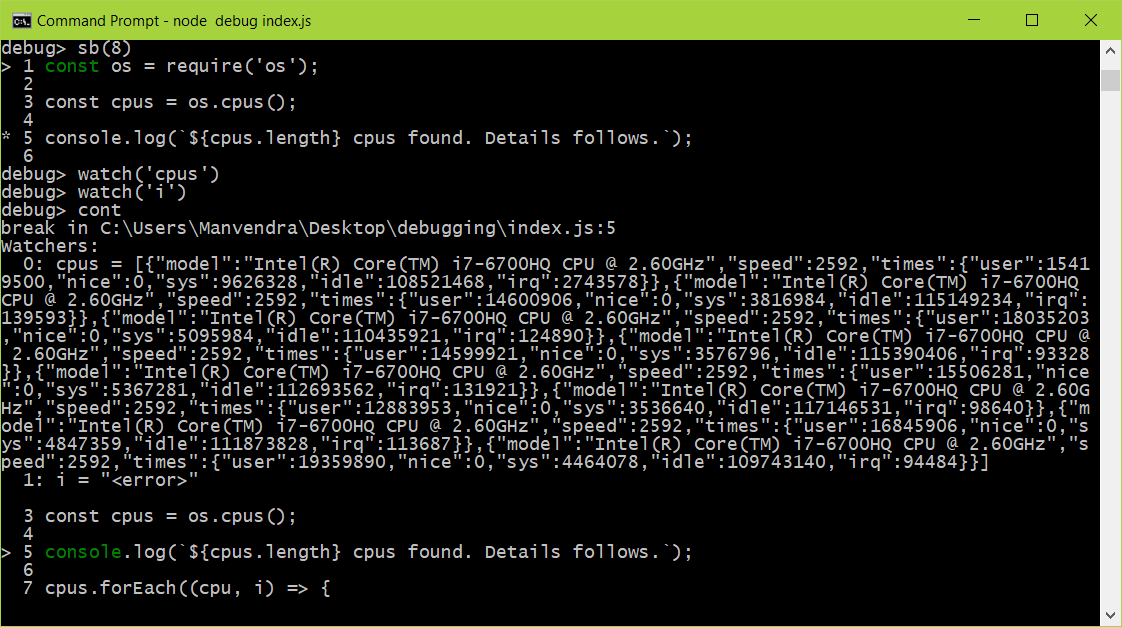
By default, the debugger would launch the program in break state, so, to execute the program type cont and you would see the script result instantly. But that’s not what we are using node debugger for, right? So let’s start script execution again using the restart debugger command and then set the breakpoint on line number 5 and 8 using sb(5) and sb(8). You can add watches, e.g., to watch the variable cpus and i, type watch('cpus') and watch('i').
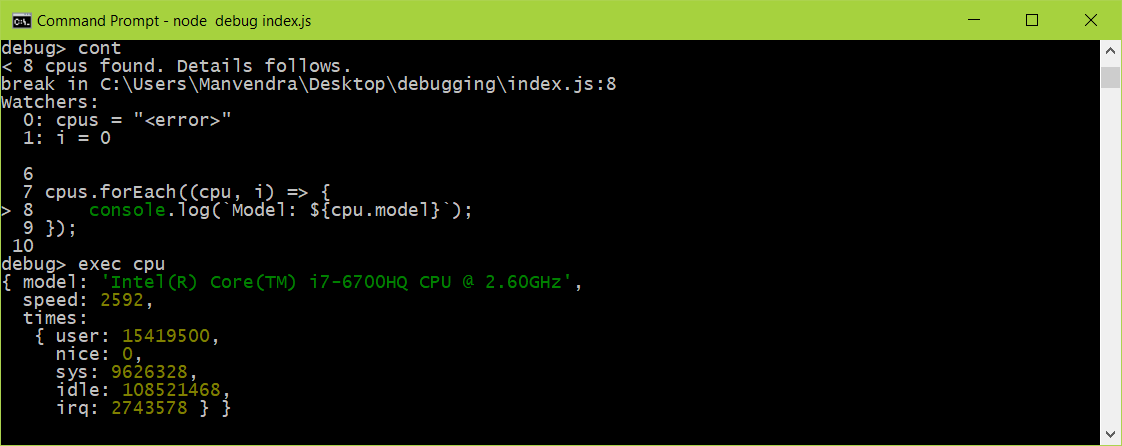
Now type cont to begin the execution of the program, note how the program execution stops at line 5 denoted by break in statement. See how the debugger showing us our watchers. If you note carefully, the second watcher i is showing "<error>". Why is that? It’s simple, i is not in the scope of debugging context, simple!
You can evaluate the script in the debugging context by typing repl command. This would drop you in debugger repl (read eval print loop). You can inspect variables by using exec command. E.g., See in the image below, I’m inspecting cpu using exec cpu. Note how watchers list showing the current value of i but cpus in error state. To go to next line of execution type next command. You can list all the available watchers by using the command watchers.
A full list of commands and their usages is available at https://nodejs.org/dist/latest-v6.x/docs/api/debugger.html.
Conclusion
Technology has always made the human life simple, and this debugging technology is much useful for the people writing software.
Debugging support has traveled a great distance. In my opinion, I would always use VisualStudio Code as I won’t have to leave my development environment where I have already opened the files I’m working on. If I rely on Chrome DevTools I would have to open each file again and then set the breakpoints, which is neither productive nor logical.
I recommend staying far away from Node.js’ debugging client. It’s not super easy and intuitive to use. I highly advocate debugging your code while writing instead after deploying.
Thanks for being here till now. See you next time.